
Whenever a current flows through a wire, it creates a magnetic field surrounding it and, if the current is variable, so will be the magnetic field.

Conversely, if we put a wire in a variable magnetic field, an electromotive force will be generated in the wire, in other words: a voltage. This voltage, in turn, produces a current in the wire when it forms a closed circuit, like a loop.

Another way to describe this phenomenon is this: if we have a variable magnetic field in a volume of space, a variable electric field will be automatically generated in that same space. It is that electric field that generates the voltage on the wire and causes current to flow through it. Again, this concept presents a duality. If I generate a variable current in a wire, a variable electric field will be present on the wire and its surroundings. As a result, a variable magnetic field will be generated in the same volume of space.

In fact, whenever there is a variable electric field, there is also a corresponding variable magnetic field and viceversa. Each of the two variable fields cannot exist without the other. They always both exist at the same time. It is for this reason, that we usually refer to them as a single field called Electromagnetic field.

And because the electromagnetic field changes over time, it also affects its surrounding space and the space surrounding that space, and so forth. Basically, the effects of the electromagnetic field is visible over long distances and so we say that electromagnetic fields propagate in space. We call this an electromagnetic wave.
Light, for example, is an electromagnetic wave and propagates in space at what we call the speed of light.
A physicist named James C. Maxwell, back in 1861, put together all the knowledge of the time and elaborated a set of 4 equations that completely describe how electromagnetic fields work and how electromagnetic waves propagate. These equations are known today as the Maxwell’s Equations.

The concept of electromagnetic waves is widely used in electronics to make devices that can receive and transmit information using this physical property. You know very well these devices. They are called radios, and they can be used on their own or inside a wide variety of more complex devices, like TV sets and cellphones.
Without the electromagnetic waves, the global telecommunications system we enjoy today would not exist.
However, there is a negative side of the electromagnetic fields and waves. Electromagnetic waves are continuously transferred from one circuit to another, or from one part of the same circuit to another as long as variable currents is produced. The problem is that, most often than not, we do not want these kind of interactions.
Whenever an unwanted signal is generated in a circuit because of the electromagnetic fields that surrounds it, we call it a noise, and we try our best to remove it.
The generation of these unwanted signals is generally called Electromagnetic Interference or, in short, EMI.
The action we take to avoid and prevent EMI is called Electromagnetic Shielding, or EMS.
Basically, it works by putting a shield in between the area where the source of the Electromagnetic field is located, and the circuit that is negatively affected.

There are several sources of EMI, some occur in nature, others are created by humans, as a by-product of the machines and devices we use daily.
Since the production of EMI is a bad thing, the governments all over the world provide guidelines to help reduce the generation and the effects of EMI. They also define rules that specify the maximum amount of EMI that any device can generate.
This helps manufacturers in creating compatible devices that do not influence each other.
If we had to make a list of all possible sources of EMI, that list would be incredibly long.
Here are just some examples.
Some natural occurring EMI:
– solar magnetic storms, that occur from time to time on the surface of the sun and may cause huge electromagnetic waves that can propagate toward Earth and cause a disruption of electric and electronic devices.

– lightning, especially during thunderstorms.

– Earth’s magnetic field flux, which is caused by moving an electric device across the magnetic field generated by the Earth, thus creating unwanted electric fields and currents inside the device.

And here are some human-created sources of EMI:
– TV sets

– Radios

– cell phones

– brush motors

– fluorescent bulbs

– computers

– tablets

– microwave ovens

– power generators

– internal combustion car engines

– arc welders

– brownouts and blackouts in the power grid

– electrical power lines, causing the well known humming that can be even heard when getting close to a high voltage power line.

– voltage sags and spikes in circuits

… and the list goes on and on. And each item in this list is potentially a noise generator that can affect and even totally disrupt the functionality of an electronic circuit.
That’s why, all the electronics equipment that is sensitive to EMI needs to be protected with shields. We call this protection “ElectroMagnetic Shielding” or “RF Shielding”.
Whenever we have an electronic device that is sensitive to electrical noise, we need to provide it with some sort of electromagnetic shielding, or EMS, to make sure that the electrical noise generated by the EMI is reduced below a value, or threshold, that the device can safely handle. Sometimes, very sophisticated and sensitive instruments have really low thresholds, a condition that is very difficult to achieve but, nonetheless, necessary.
Examples of electronic devices that need EMS are:
– electric wires used to transport audio, video and radio frequency signals: to protect them we usually do things like surrounding them with a metallic shield. Such cables are called coaxial cables.

– RF equipment: radios, cellphones, TV sets, and so forth, need to be shielded from unwanted noise. In fact, EMI can make sounds difficult to understand, or it can distort pictures and videos, for example.

– Audio equipment: again we don’t want to hear noise when we are listening to our preferred song or band.

– medical equipment: EKG machines, diagnostic equipment and the sort affect human life and we don’t want that the wrong noise at the wrong time causes somebody to die.

– Avionics: what if the airplane instruments stop working during landing because some EMI was generated by the unshielded device of a passenger? That’s why they don’t want you to use any sort of electronic devices during take off and landing.

– certain lab tools, like oscilloscopes: we want them to measure the signals of our circuits under test, not the noise produced by electromagnetic fields in the room where the instrument is located.

And again, the list goes on and on.
Whenever we create a new device, we always need to make sure, first, that it will not cause EMI that can affect other devices; and, second, that it will not receive too much EMI from the surroundings.
The ability of creating Electromagnetic shielding depends on two different properties of the materials: the conductivity, which is the capability of allow the movement of electric charges, and the magnetic permeability, which is the capability of a substance to facilitate the flow of a magnetic field through it. In other words, the permeability works for the magnetism like the conductivity works for the electricity.
The conductivity property allows to shield from electric fields and the permeability property allows to shield from magnetic fields.
Unfortunately, there are no materials that have simultaneously a good conduction and a good permeability. So, we choose one material or another depending on what aspect we need to give priority.
Shielding due to conductivity is achieved by the property of what is called the Faraday Cage.
Michael Faraday was a British scientist that invented the device in 1836. The cage was capable of shielding people from electric strikes and from electrostatic discharges. That device is today known with his name, the Faraday’s cage, and its principle is extensively used to provide electric shielding of all sorts.

It is basically a cage made of conductive material and is capable of shielding whatever is inside of it against electrostatic and electric fields.
It works because an external electric field causes modifications in the distribution of the charges in the conductor. Once the charges are redistributed, they produce on their own another electric field that cancels out the original field and prevents it to enter inside the cage. The better is the conductor of which the cage is made of, the better the cage works.
Note, however, that the cage is supposed to be a continuous covering of conductive material, without holes. Only that way it can prevent electric fields from going inside. In practice, we do need openings in the cage, otherwise it would not be possible to put anything inside of it. But, as long as the openings have a size much smaller than the length of the electric waves that we want to shield, the Faraday’s cage will work as if it was a continuous covering.
So, for lower frequencies we can have bigger openings, but for higher frequencies we need to make them smaller and smaller, up to the point that for very high frequencies we really need a continuous covering.

Another aspect of the Faraday’s cage is its bad efficiency at the higher frequencies due to what is called the skin effect.
When a constant current flows inside a conductor, all the movable charges inside the conductor participate in creating the current.
But, when we have an alternate current, the center of the conductor is used less and less with the increase of the frequency. So, at the highest frequencies, if we don’t have a very good conductor, since the current will only move in a thin outer layer of the whole conductor, or the skin, the resistivity will be so high that the electrons inside will not move fast enough to counterbalance the electric field and so the shield will not be effective.

That’s why at the highest frequencies shields are usually made with an external layer of copper or even silver, which is the best known conductor.
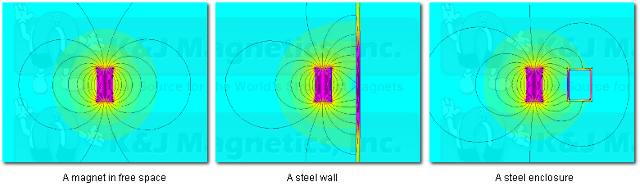
When we need to create a shield for a magnetic field, a good conductor doesn’t do any good. For magnetic fields, we need to use materials with high permeability to magnetic fields which, conversely, are poor conductors.
The big difference with magnetism is that we cannot separate north and south poles like we do with the positive and negative charges, Therefore, the lines of a magnetic field always go from the north pole to the south and cannot be interrupted.
What we can do is to merely deviate the field lines and force them to go through a high permeable material, away from the device that we want to protect.

This is a totally different approach from the electric fields, where we actually cut the field lines and prevent them to go inside the Faraday’s cage.
Materials
As we already said, there are two kind of shielding: those that work better against electric fields, and those that work better against magnetic fields.
Different materials have been adopted over time to achieve these two goals.
To shield from electric fields, we need to use good conductors. The best conductors, however, like silver and copper, are very expensive. So, whenever possible, the tendency is to use slightly less conductive metals that are still very efficient at the particular frequencies where the shield is supposed to work.
And so you can see shields that are made of aluminum, steel or nickel, and only when strictly necessary copper or even silver is used.
Shields for electric fields can then be shaped as a solid box, or as a mesh, or a metallic foil, depending on the mechanical and electrical needs. To protect plastic boxes, there are even certain conductive paints that can be used to coat the plastic and obtain a relatively good shielding.

To shield from magnetic fields, we need to use a material that is permeable to magnetic fields.
Iron and steel are the obvious examples, but there are some alloys that are particularly good for magnetic shielding, like silicon-iron and mu-metal.
Just to give you an idea, the relative permeability of the air is defined as 1.
Iron with 0.2% impurities has a relative permeability of 5000.
Silicon-iron has a permeability of 7000.
And mu-metal has a permeability of 100,000.
Depending on how thick we can make the shield and the amount of magnetic energy that we want to stop, we will need to choose one solution or the other.
For electronic circuits, however, we deal most of the time with electromagnetic waves and not with constant or quasi-constant fields.
Since electromagnetic waves have both an electric and a magnetic component, and since one cannot exist without the other, it is enough to shield from one of the two component to block the whole wave.
That is why, electronic devices are usually only shielded against the electric fields, which are the easiest shields we can obtain. Doing so, we can stop or reduce the electric component of the waves and, therefore, the whole waves, since the magnetic component will go away as well, just because the electric component is not there anymore.
When creating an EMS, or an electromagnetic shielding device, we need to be careful to make it in such a way that it will actually shield our electronic circuit, rather than actually collect even more noise. Unfortunately, it is very easy to obtain the opposite effect.
For example, if the shielding of a device is not connected to ground, the current that flows in the shield will non be able to be discharged anywhere. As a result, all the energy will be reflected in the surrounding space, thus defeating the purpose of having a shield or, even worst, causing some resonating effect that could create even more noise.
Another cause of trouble is when the shielding is done in such a way that the internal currents move around in a loop. If that happen, the loop will actually cause a concentration of the eletromagnetic waves, thus causing more trouble than not having a shielding at all.
The last issue I would like to mention is the one of the gaps in the shielding which, if too large compared to the wave length of the noise, will not be able to prevent the noise itself to go through. We therefore need to be very careful when making holes in the shielding, for example, to allow wires to go through. Or to allow us to see the display of an instrument. If the opening is too large, compared to the wavelength, the noise will no through and the shielding will be ineffective.
EMS is always a hot topic in electronic devices, whether they are low or high frequencies. We need to spend a lot of thoughts when designing the case of a device and, in case of radio frequency, even the design of the PCB deserves a lot of attention to prevent unwanted coupling of the signals from one section of the PCB to another, which is basically noise that is generated and distributed internally to the circuit itself.
It is also important to distinguish cases where the device is supposed to deal with very low signals versus those cases where the signal is higher.
When dealing with low signals, we may end up with noise that has the same magnitude of the signal being treated, and so we have to put a particular attention to the suppression of the noise, which could otherwise overwhelm the wanted signal.
When dealing with higher level signals, the surrounding noise could sometimes be considered negligible and, in such a case, the EMS becomes less of an issue.
It is important, therefore, to address each case individually. There is no common solution that can be adopted for everything.


